13. Web User Interface
13.1 General information
- The web interface allows users to browse and export results and other data from a remote computer, as well as monitor the state of the instrument (active process, cartridge level, alerts etc.)
- The BactoSense needs to be connected to the same network as the computer that accesses the web interface.
- The web interface can be loaded on any browser on desktop computers or mobile devices.
- Take care about data and network security with all usual measures.
13.2 Connect to the web user interface
An admin must first enable HTTP or HTTPS web access under Settings → System settings → System services, apply the changes and reboot when prompted. See Retrieve files via HTTP or HTTPS for the service settings and ports.
WORK STEP | ADDITIONAL INFO / IMAGES | ||
|---|---|---|---|
1. | Connect the BactoSense via Ethernet to a safe network (e.g. LAN). Connect your device (e.g. computer or tablet) to the same network. | ||
2. | On the Home screen of the BactoSense user interface, press Settings, then System info. |
|
|
3. | Retrieve the IP address of the BactoSense shown on the System info page. | ||
4. | On your device, open a web browser. | ||
5. | Enter | ||
6. | On the login page, use the same username and password as for the BactoSense and press Login. | ||


13.3 Start page in manual mode
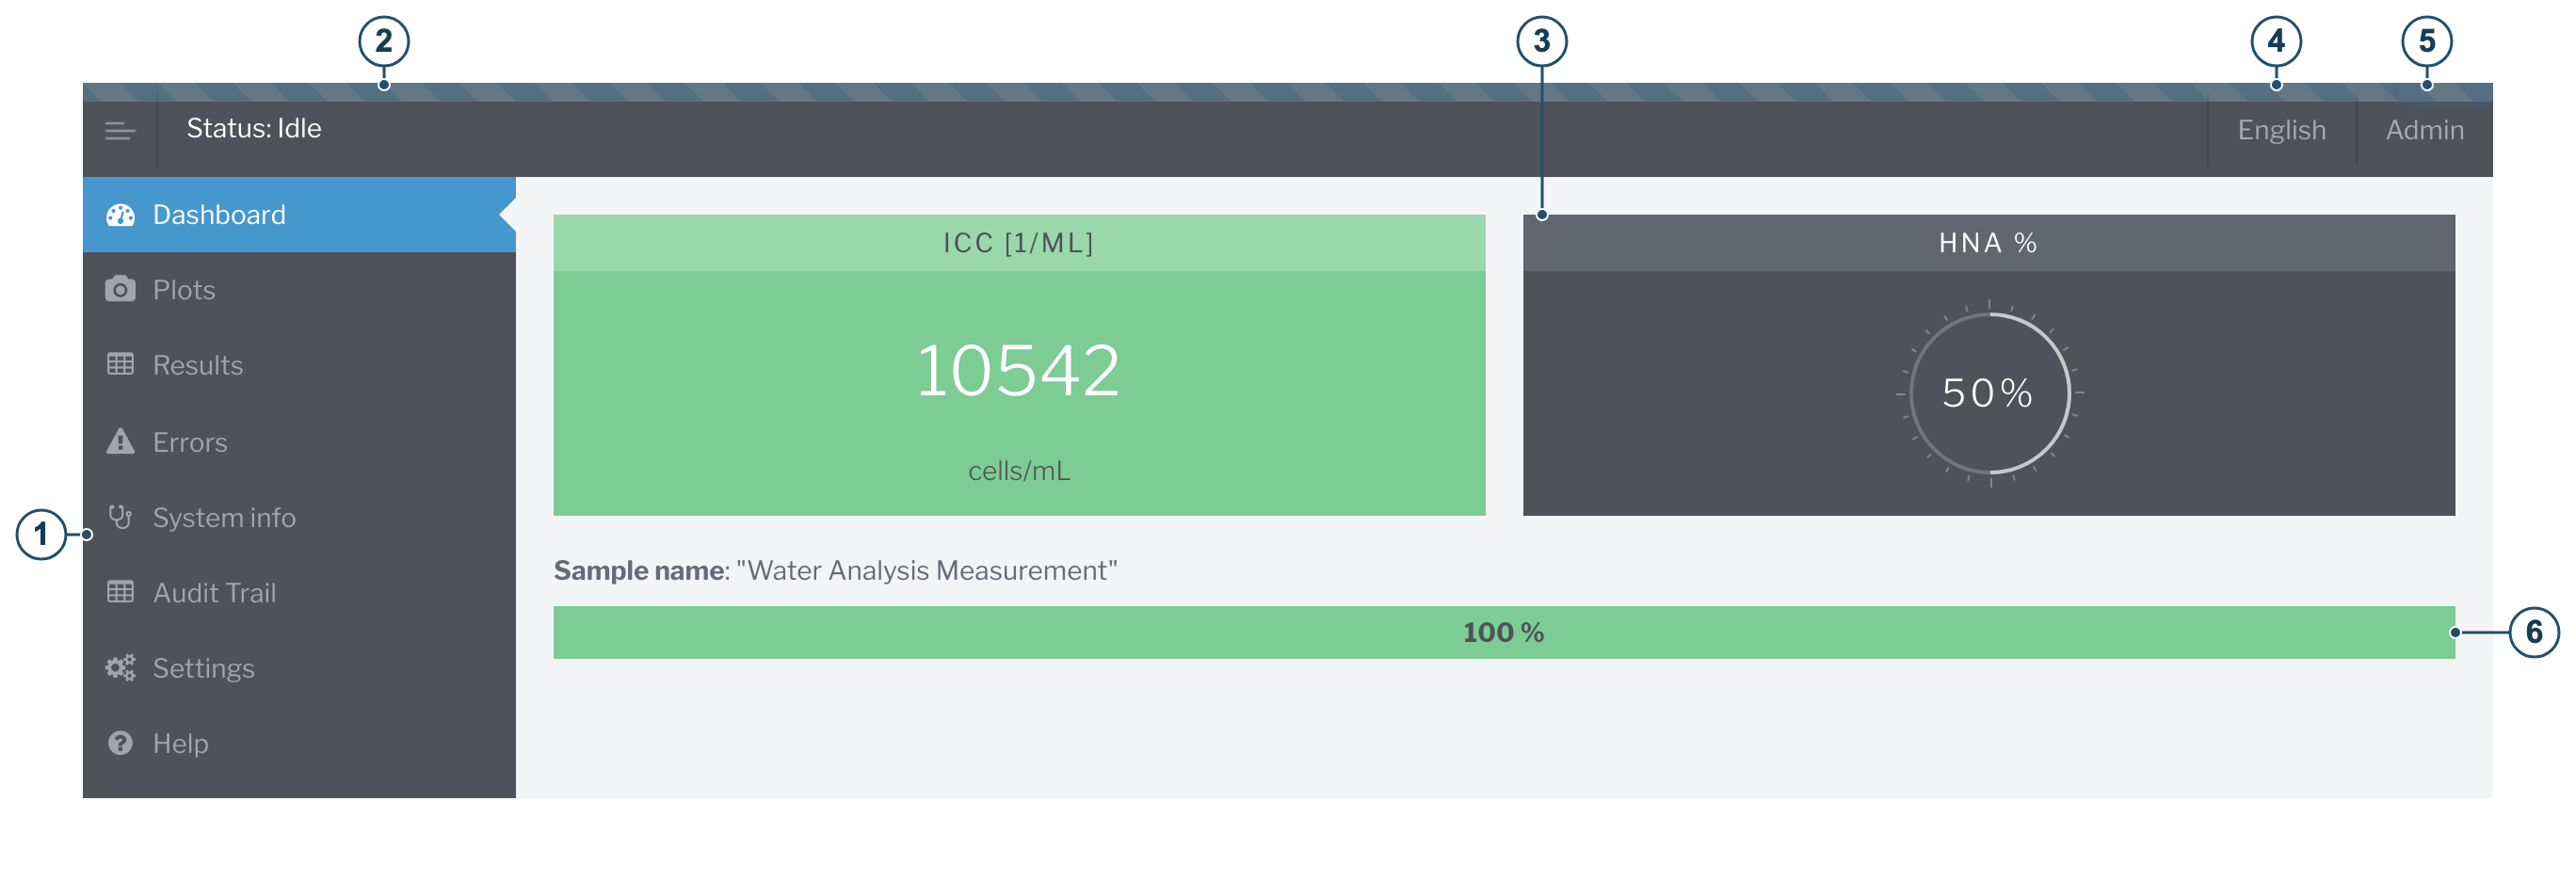
Figure 13-1 Start page on web user interface
| 1 | Menu | 2 | State of the instrument |
| 3 | Dashboard with latest results | 4 | Language: Drop-down menu for changing the language. |
| 5 | User menu: sign out; admin and service accounts can also reboot the BactoSense | 6 | Progress of the current measurement |
13.4 Download an FCS-file
| WORK STEP | ADDITIONAL INFO / IMAGES | |
|---|---|---|
| 1. | On the web interface, select the Results page on the navigation panel on the left. | |
| 2. | Find the measurement in the appropriate result table below the chart. Scroll horizontally to the links at the right of its row if needed. | |
| 3. | Click the fcs link (Position X). | 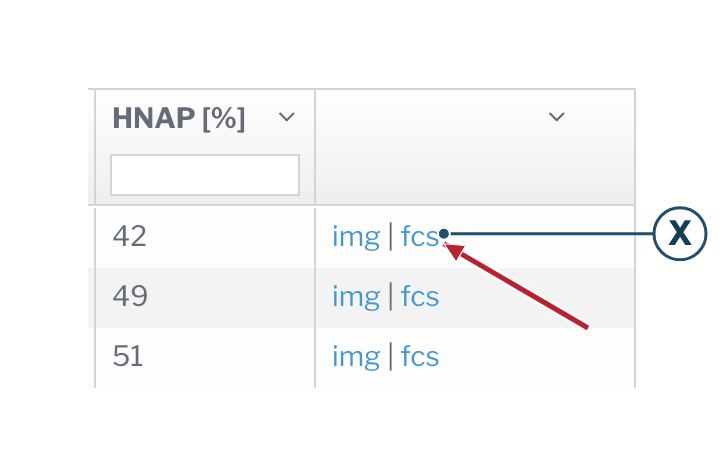 |
| 4. | Wait for the download to complete. |
13.5 Download a zip file with multiple results
The results from multiple measurements can be downloaded as a zip file. This zip includes the FCS file and summary plots of each measurement.
| WORK STEP | ADDITIONAL INFO / IMAGES | |
|---|---|---|
| 1. | On the web interface, select the Results page on the navigation panel on the left. | |
| 2. | Find the Online mode results or Manual mode results table for the measurements you want. | |
| 3. | Select the date range for that table and click Download ZIP. A progress bar will appear at the top of the browser until the zip starts downloading. |  |
| 4. | Wait for the download to complete. |
13.6 Download all results as CSV, XLSX or PDF
The list of all results can be downloaded from the web interface in Excel XLSX, CSV or PDF format. Online mode, Manual mode and instrument validation results have separate downloads.
| WORK STEP | ADDITIONAL INFO / IMAGES | |
|---|---|---|
| 1. | On the web interface, select the Results page on the navigation panel on the left. | |
| 2. | Find the DOWNLOAD RESULTS section below the results chart and choose the row for the required measurement mode or instrument validation. | |
| 3. | Click Download XLSX, Download CSV or Download PDF in that row to start the download. | 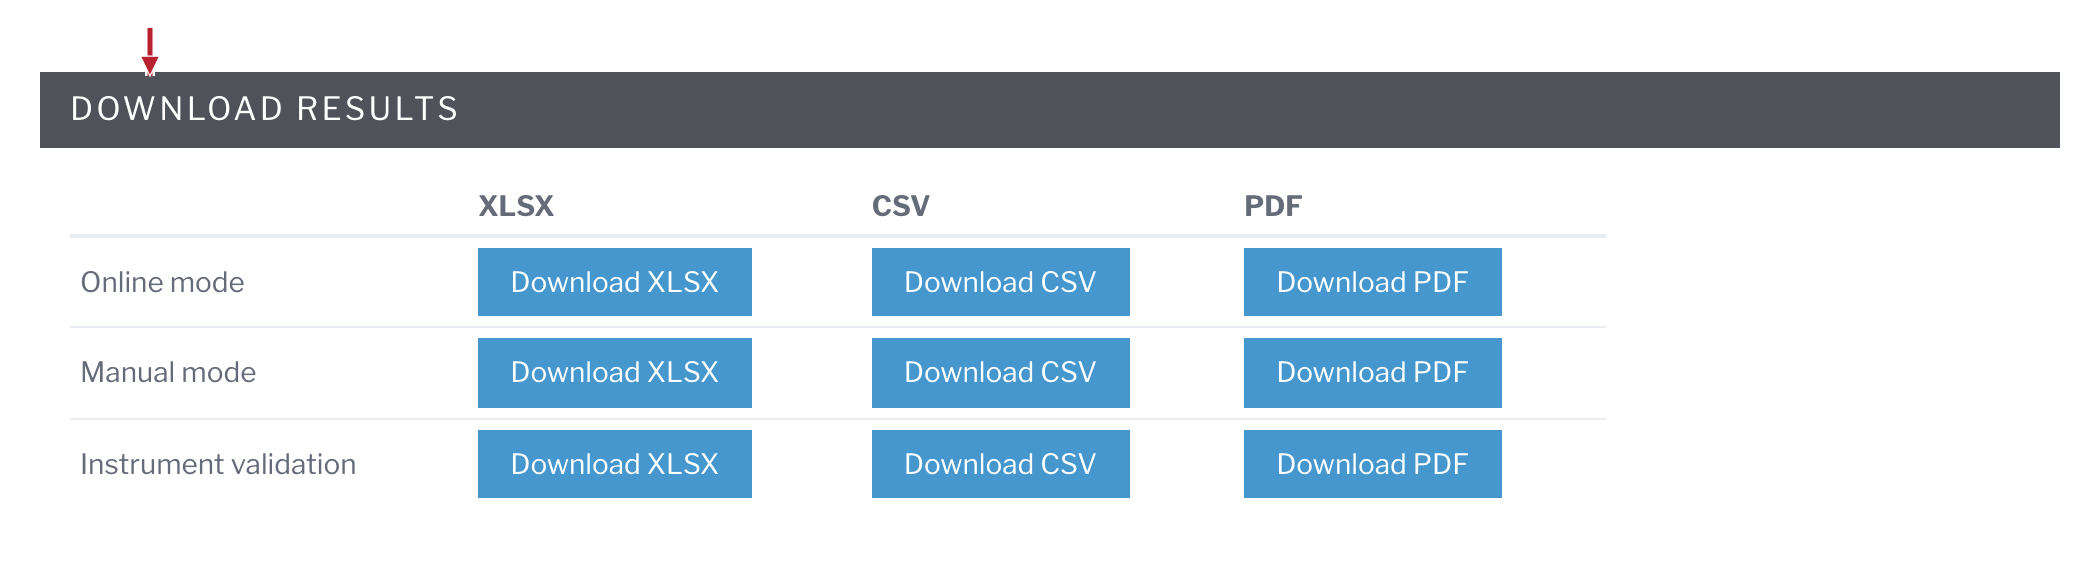 |
| 4. | Wait for the download to complete. |
13.7 Animate the evolution of dot plots
The web interface can animate dot plots from Online mode, to help visualize the progression of the measurements. This feature shows static images in rapid succession; the animation can be exported with the Download GIF button.
| WORK STEP | ADDITIONAL INFO / IMAGES | |
|---|---|---|
| 1. | On the web interface, select the Plots page on the navigation panel on the left. |  |
| 2. | Use the previous and next arrows or the slider to select a measurement by its timestamp. |  |
| 3. | Press the triangle Play button to start the animation. Press it again to pause. |  |
| 4. | Set Animation speed to the desired positive number of plots per second. | |
| 5. | Press Download GIF to export up to 60 of the most recent Online mode plots at the selected speed. The export uses the latest plots, regardless of the slider position. |
13.8 Change the measurement interval
The interval used for Online mode measurements can be changed from the web interface.
| WORK STEP | ADDITIONAL INFO / IMAGES | |
|---|---|---|
| 1. | On the web interface, select the Settings page on the navigation panel on the left. | 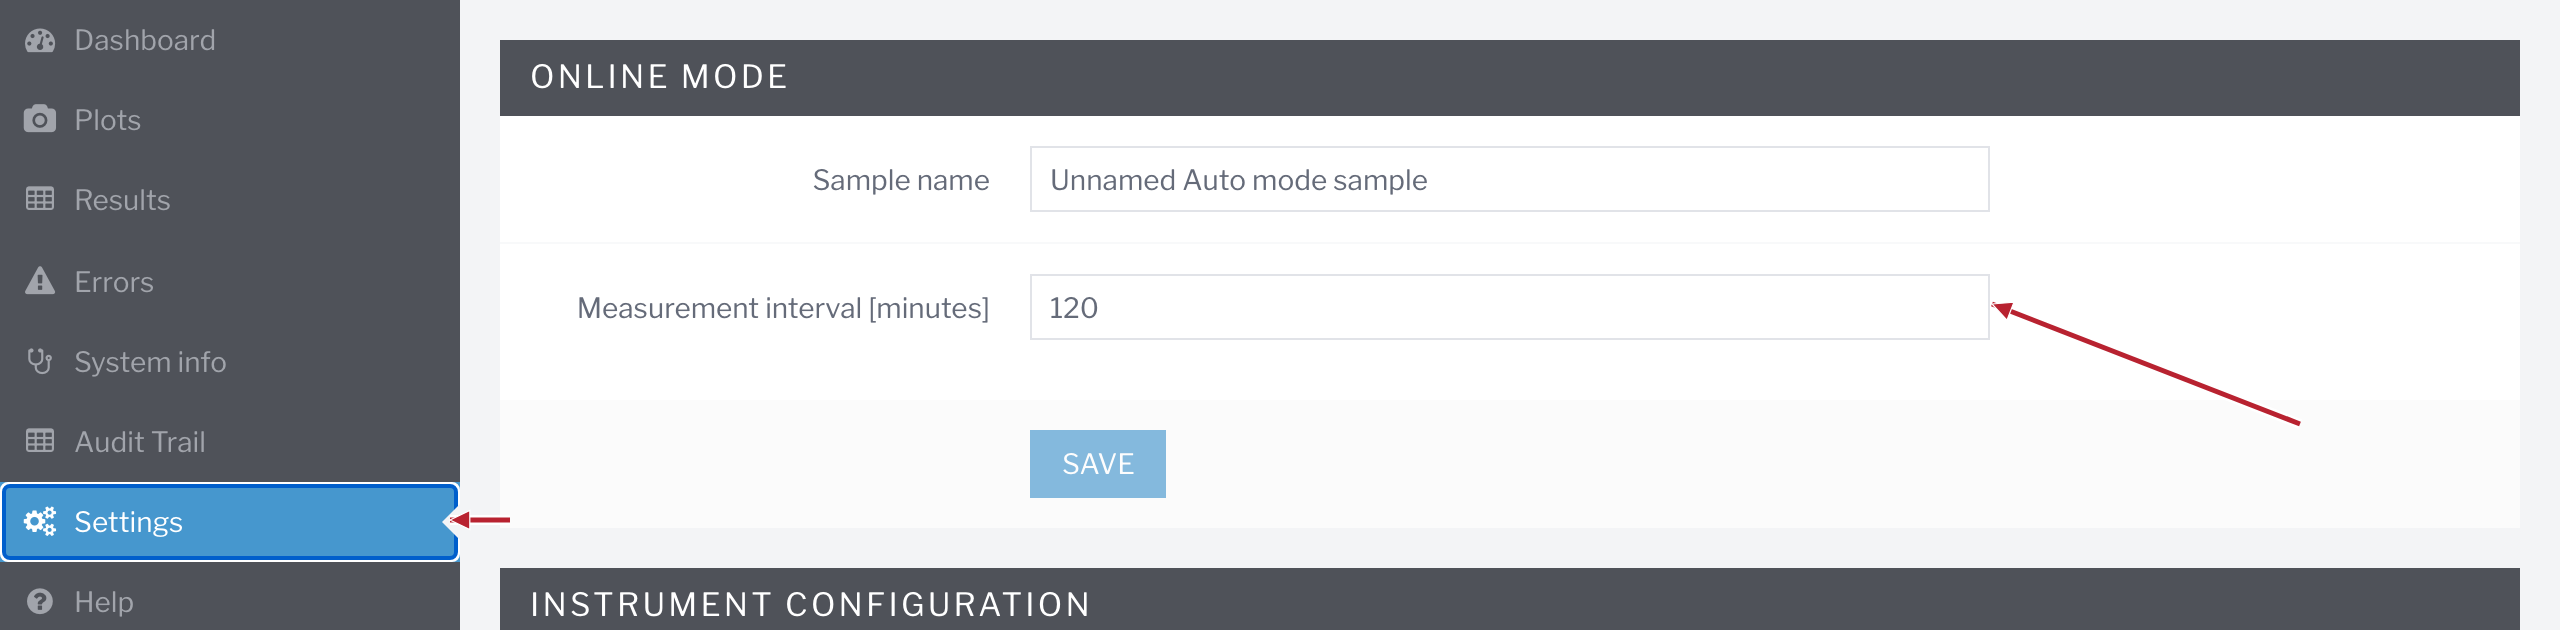 |
| 2. | Enter an interval from 30 to 360 minutes in Measurement interval [minutes]. | |
| 3. | Click SAVE to apply the interval. |
13.9 Take screenshots of the GUI
Take screenshots of the BactoSense GUI from the web interface:
| WORK STEP | ADDITIONAL INFO / IMAGES | |
|---|---|---|
| 1. | On the web interface, select the System info page on the navigation panel on the left. |  |
| 2. | Press the Get screenshot button at the bottom of the page. | |
| 3. | The screenshot is displayed below. |
13.10 Reboot from web user interface
An admin or service account can reboot the BactoSense from the web interface according to the following procedure.
The instrument cannot switch on remotely.
| WORK STEP | ADDITIONAL INFO / IMAGES | |
|---|---|---|
| 1. | In the top right corner of the web interface, click the username to open the user menu. | 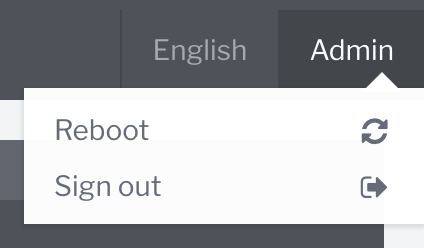 |
| 2. | Select Reboot, then click Reboot in the confirmation dialog. | |
| 3. | Wait for the instrument to restart, reload the web interface and sign in again if prompted. |