11. Results and Data Analysis
11.1 Measurement results
The figure below shows the result of a selected TCC measurement in Online mode. From here, the user can delete or rename the measurement, look up older results (and export them), or export the result. Expert users can repeat the cell counting with new gates. Some user interface elements or actions are only available to specific user roles (Basic, Advanced or Admin).
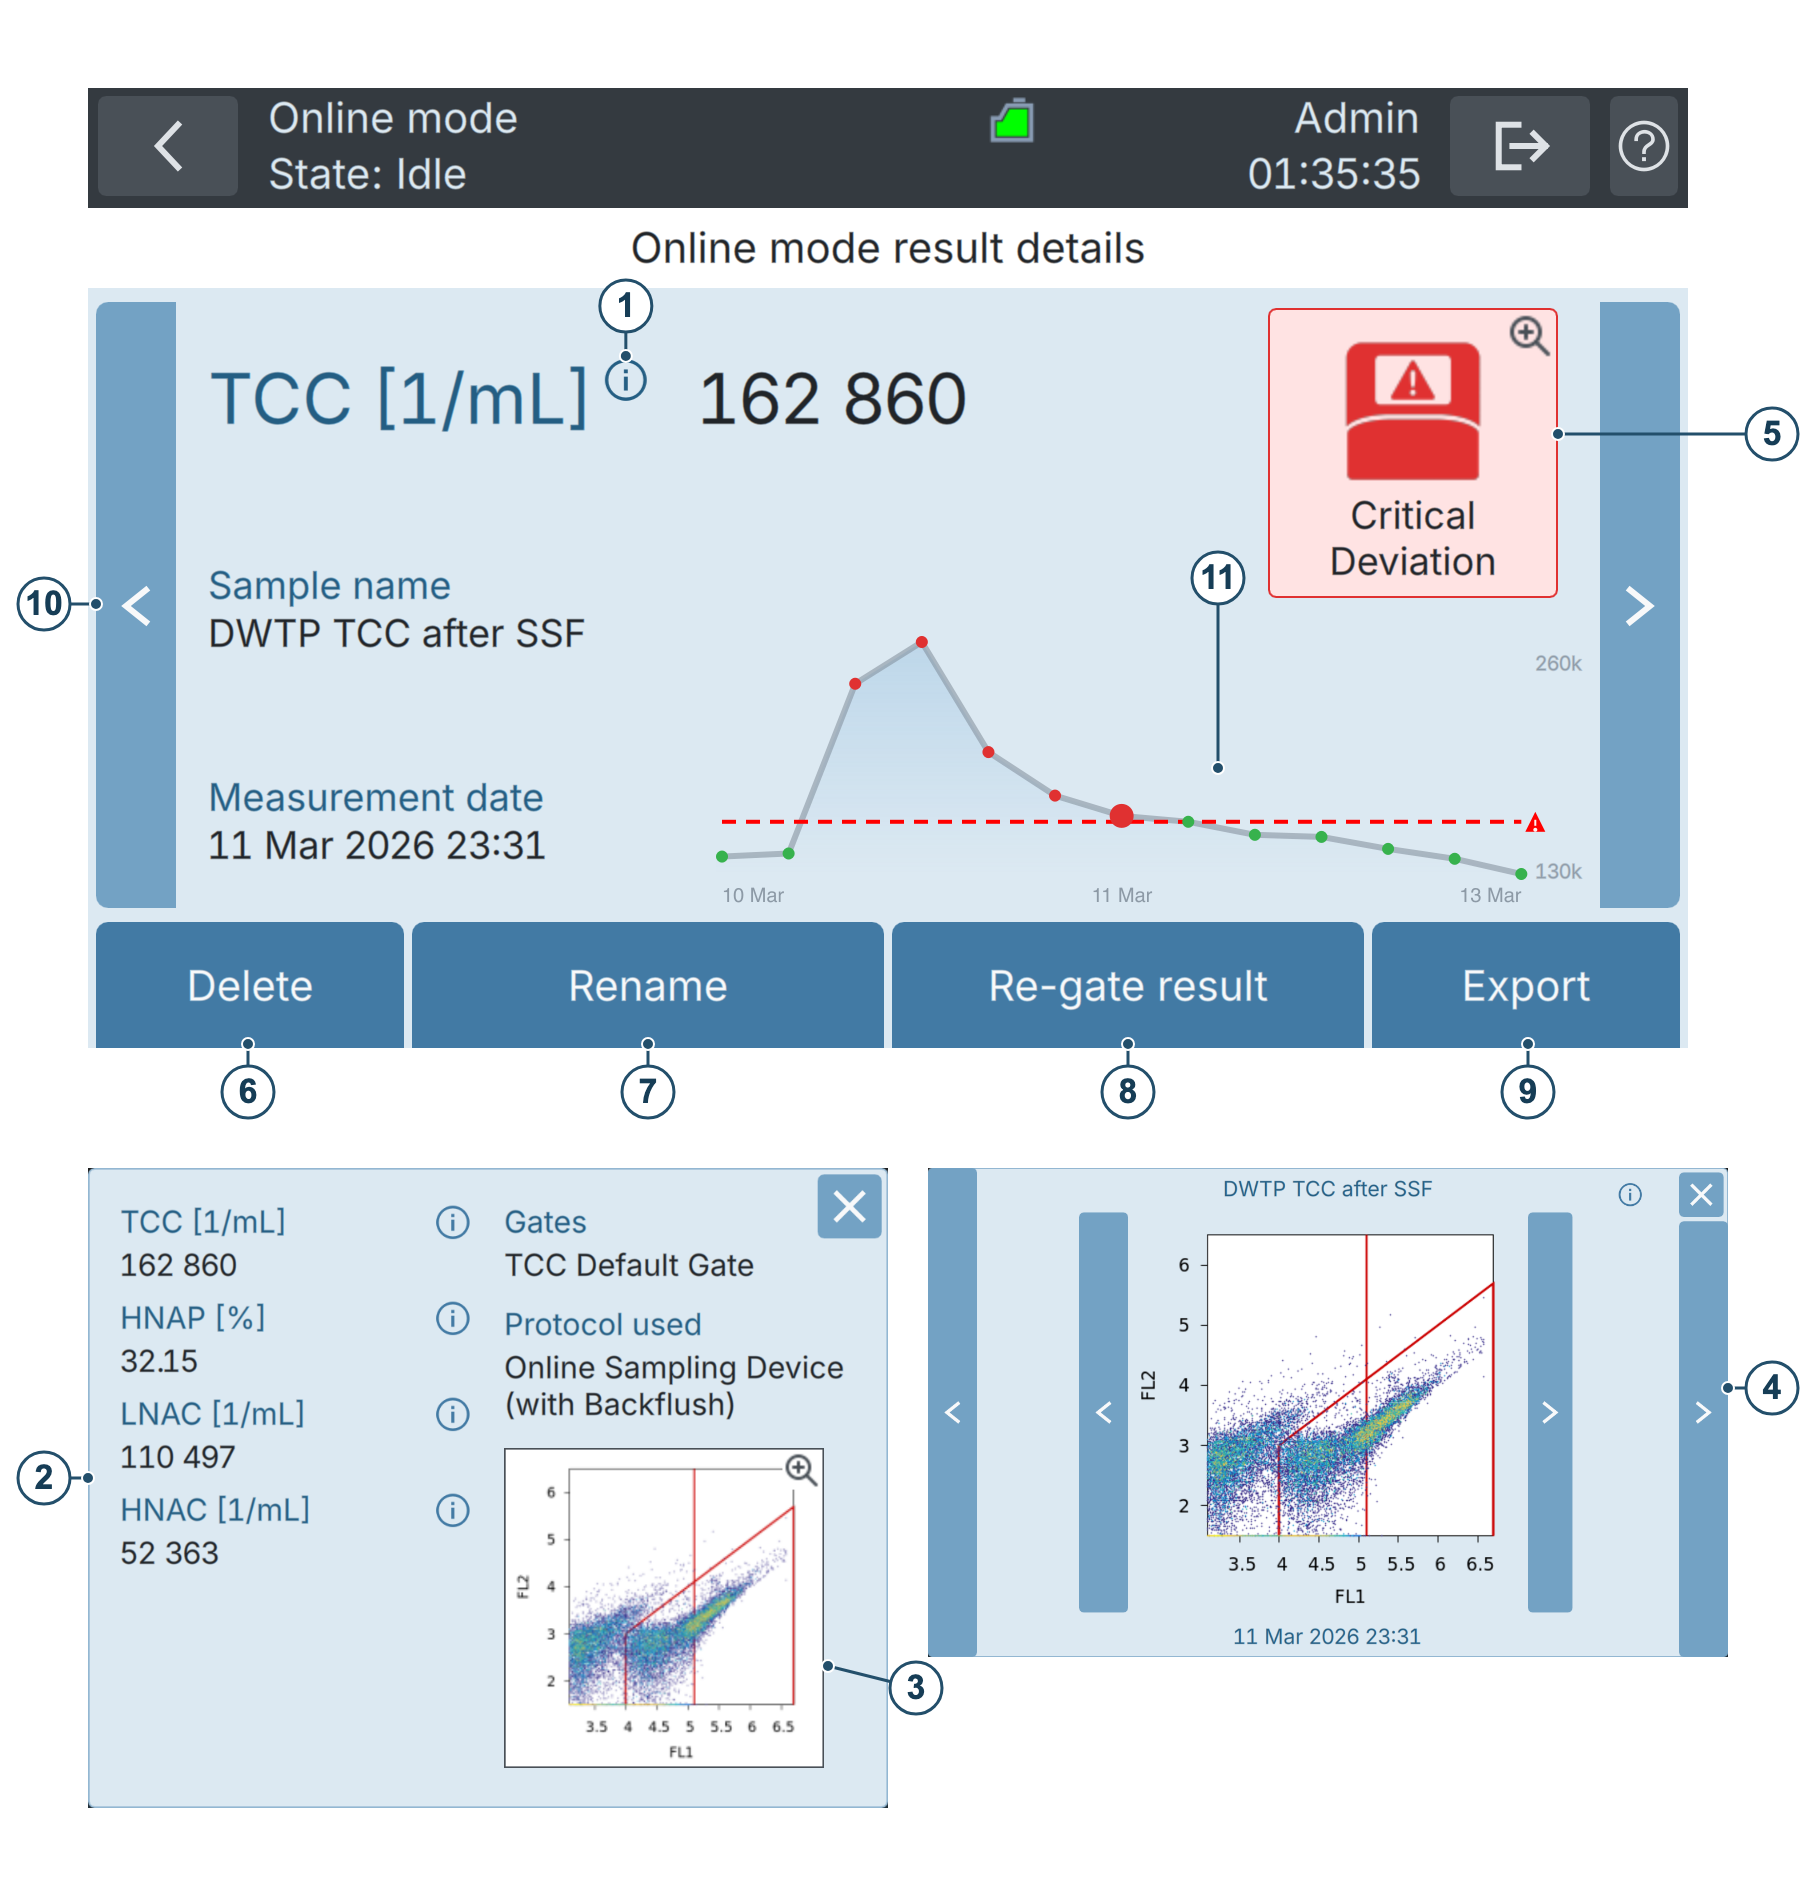
Figure 11-1 Display of a TCC measurement result in Online mode.
| 1 | Main result parameters, depending on cartridge type used. Find more information in Cartridges, gates and result parameters. Tap the information icon beside the main result to display all result parameters (2). |
| 2 | Result information window with all available result parameters and the main dotplot. |
| 3 | Main dotplot in the result information window. The FL1 vs FL2 dotplot shows all detected events according to the amplitude of their fluorescence signals FL1 (535 nm, X-axis) and FL2 (715 nm, Y-axis). The red polygon and vertical line show the configured gate. For details refer to Cartridges, gates and result parameters. Tap this dotplot preview to open a pop-up with access to all dotplots (4). |
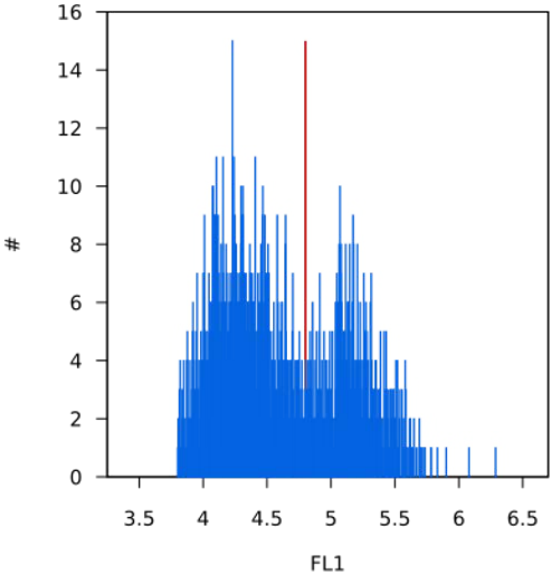
| 4 | Pop-up window with access to all dotplots. The FL1 vs SSC dotplot shows only cells inside the FL1 - FL2 polygon gate, according to their fluorescence signal FL1 (535 nm) and scattered light signal SSC (488 nm). The FL1 histogram shows all cells inside the FL1 - FL2 polygon gate, binned according to their fluorescence in FL1. The available dotplots depend on your instrument model and configuration. |
| 5 | The measurement status field indicates alarms or warnings. Tap an alarm or warning indication to view its details. |
| 6 | The Delete button removes the measurement permanently (requires confirmation). |
| 7 | The Rename button can be used to change the measurement name. |
| 8 | The Re-gate result button allows to apply a different gating to the measurement data. For details refer to Regate measurements. |
| 9 | The Export button allows to save this result to a USB stick. More information can be found in Export to a USB drive. |
| 10 | The navigation buttons on the left and right of the result view allow you to navigate to the previous and next measurements, respectively. |
| 11 | Touch the trend plot to open the Auto mode plot (the full Online results chart). See Reviewing automatic online measurements. |
Multiple selection & batch operations: In the list of measurements, long-press on one measurement to activate the selection of multiple measurements, then select Delete / Re-gate or Export.
11.2 Introduction to gates
Following flow cytometry standards, the BactoSense uses gates to count cells in samples.
We define:
- Gate: A line or polygon applied to a dotplot to quantify populations of measured cells.
- Set of gates, or gating set: A collection of two or more gates, used for the gating strategy. The types of gates are fixed, but users can change the limits of each gate. These are different for TCC and ICC measurements.
- Gating strategy: Defines how the gates are combined to count cells. For example, HNAC is the number of cells that are inside the TCC polygon and higher than the HNA lower limit. These strategies are different for TCC and ICC measurements.
Gating sets are specific for a type of cartridge. As an example, only gating sets of type TCC can be used with measurements performed using a TCC cartridge.
11.2.1 Default gating sets
The BactoSense has preconfigured gating sets for all available cartridge types. These gating sets are called Default gating sets. They have been carefully designed to be applicable to the vast majority of samples.
- On the Home screen, press Settings, then Gate settings to view the available gating sets.
- Default gating sets can neither be modified nor deleted.
- New gating sets can be created by editing a copy of an existing gating set, as described in Create a new gating set.
11.2.2 List of available gating sets and operations
On the Home screen, press Settings, then Gate settings to view the available gating sets.
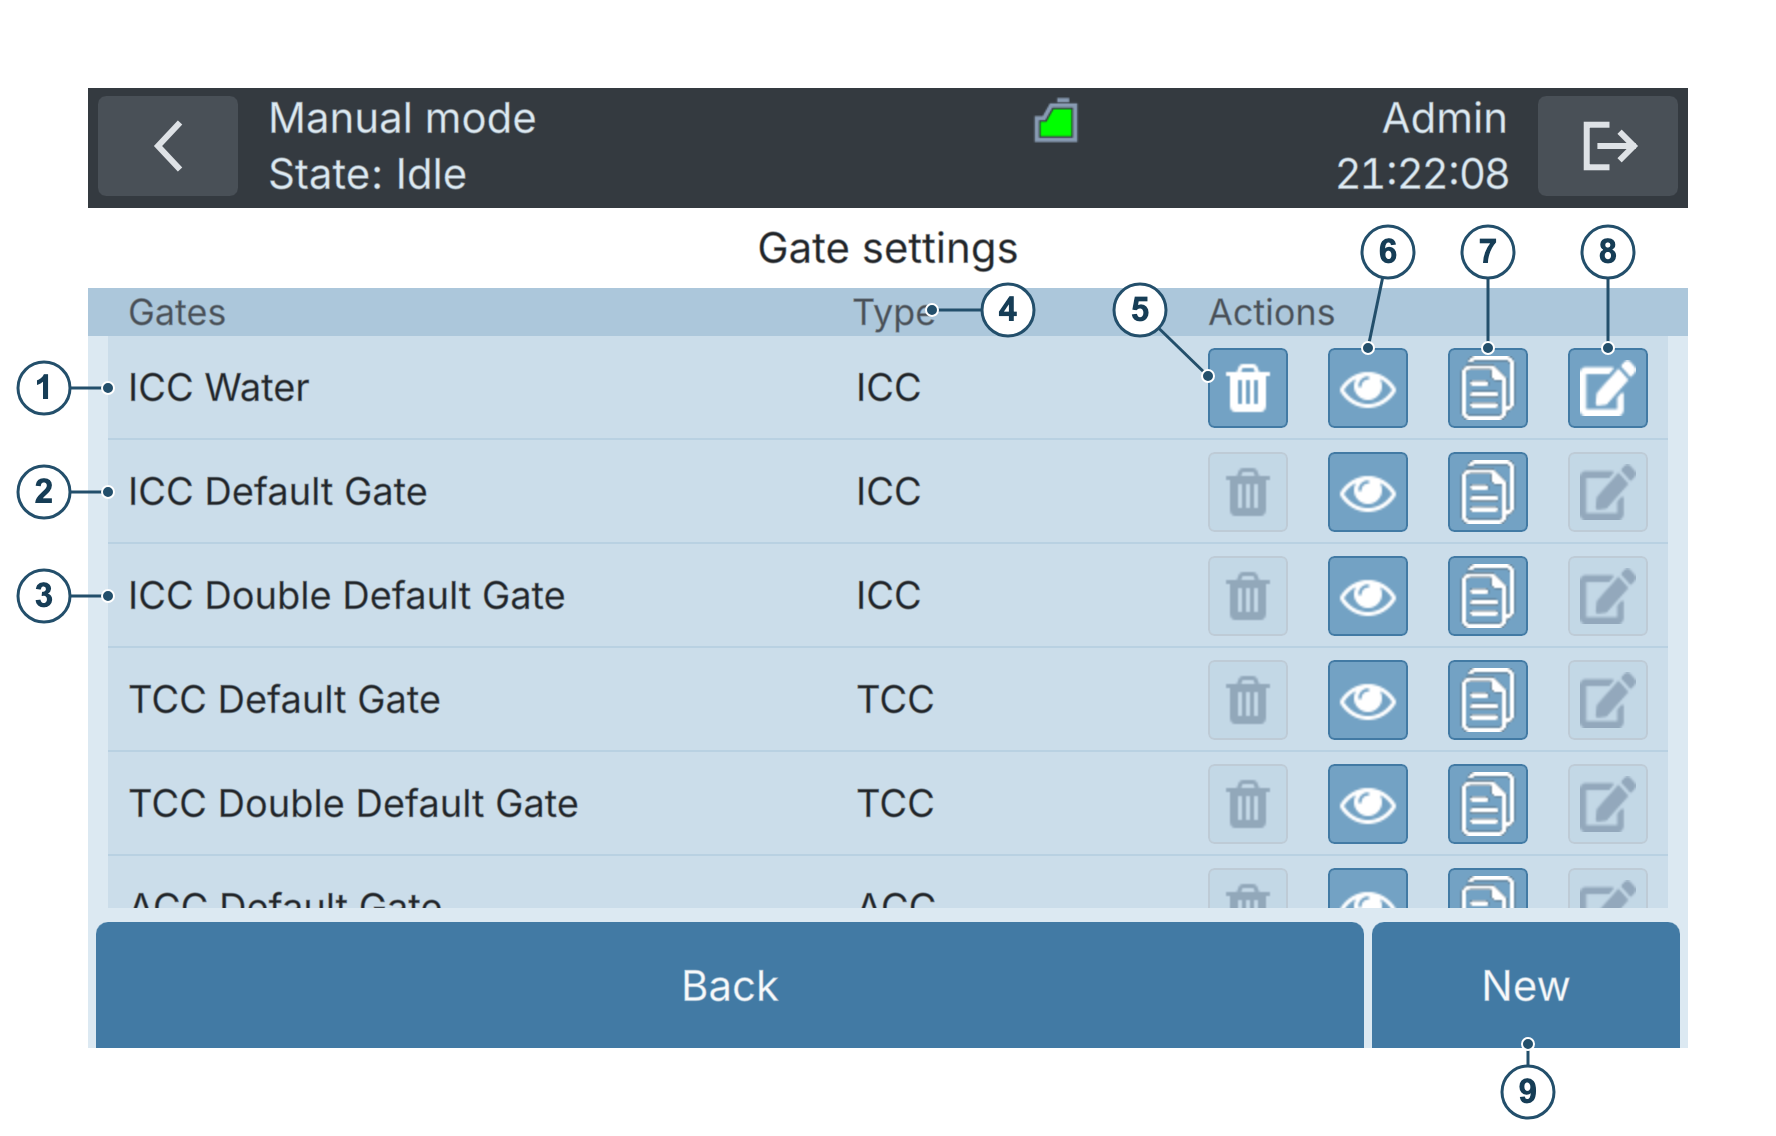
Figure 11-2 List of available gating sets and options to copy and create new sets. Default gates are preconfigured and cannot be deleted or edited.
| 1 | Example of a custom gate for the ICC cartridge. | 2 | ICC default gate. Default gates are preconfigured. |
| 3 | ICC double default gate. This gating set contains an additional configurable polygon gate. Note: For some instrument models, an additional feature is needed for using the additional gate (see Scientific package). | 4 | Gate types, to be used with the respective cartridge type. |
| 5 | Delete an existing gating set. Default gates can not be deleted. | 6 | Preview the gating set. |
| 7 | Create a copy of the gating set. | 8 | Edit the gating set. Default gates can not be edited. |
| 9 | Create a new gating set. |
11.3 Cartridges, gates and result parameters
Depending on the cartridge used for a measurement, different parameters are measured. The subsections below describe gating sets and result parameters for TCC (Total Cell Count), ICC (Intact Cell Count), ACC (Active Cell Count), CBC (Coliform Cell Count), EBC (E. coli Cell Count), and NBC (Enterococcus Cell Count).
CBC, EBC and NBC cartridges are compatible with BactoSense ID and BactoSense SMART. Each uses selective enzymatic labelling and a single polygon gate, and reports one cell concentration. No HNA or activity subpopulations are calculated for these cartridges.
CBC, EBC and NBC are cell concentrations expressed in cells per millilitre (1/mL). Cell counts and culture results expressed in colony-forming units (CFU) measure different properties of a sample and cannot be compared directly.
11.3.1 TCC cartridge
TCC refers to Total Cell Count. The TCC cartridge is therefore used to measure the concentration of all cells.
Table 11-1 Gating set used for the TCC cartridge.
| GATE | TYPE | DESCRIPTION |
|---|---|---|
| TCC | Polygon | A polygon defined on the FL1-FL2 plane. Points inside this polygon are counted as cells (TCC). |
| HNA lower limit | Vertical line | A threshold on FL1. Points within TCC but larger than the HNA lower limit in FL1 are counted as HNAC. Points within TCC but smaller than the limit are counted as LNAC. |
Table 11-2 Result parameters obtained from the TCC cartridge.
| PARAMETER | UNIT | NAME | DESCRIPTION |
|---|---|---|---|
| TCC | 1/mL | Total Cell Count | Total number of cells detected inside the TCC gate. It is an addition of HNAC and LNAC: TCC = HNAC + LNAC |
| HNAP | % | High Nucleic Acid Percentage | The percentage of HNA cells relative to TCC: HNAP = (HNAC / TCC) × 100 |
| LNAC | 1/mL | Low Nucleic Acid Count | The number of cells inside the TCC gate, but below the HNA lower limit (vertical line gate). |
| HNAC | 1/mL | High Nucleic Acid Count | The number of cells inside the TCC gate and above the HNA lower limit (vertical line gate). |
For further information on how to adjust the gates see Change gates.
11.3.2 ICC cartridge
ICC refers to Intact Cell Count. The ICC cartridge is therefore used to measure the concentration of intact cells.
Table 11-3 Gating set used for the ICC cartridge.
| GATE | TYPE | DESCRIPTION |
|---|---|---|
| ICC | Polygon | A polygon defined on the FL1-FL2 plane. Points inside this polygon are counted as intact cells (ICC). |
| HNA lower limit | Vertical line | A threshold on FL1. Points within ICC but larger than the HNA lower limit in FL1 are counted as HNAC. Points within ICC but smaller than the limit are counted as LNAC. |
Table 11-4 Result parameters obtained from the ICC cartridge.
| PARAMETER | UNIT | NAME | DESCRIPTION |
|---|---|---|---|
| ICC | 1/mL | Intact Cell Count | Total number of intact cells inside the ICC gate: ICC = HNAC + LNAC |
| HNAP | % | High Nucleic Acid Percentage | The percentage of HNA cells relative to ICC: HNAP = (HNAC / ICC) × 100 |
| LNAC | 1/mL | Low Nucleic Acid Count | The number of LNA cells inside the ICC gate, but below the HNA lower limit (vertical line gate). |
| HNAC | 1/mL | High Nucleic Acid Count | The number of HNA cells inside the ICC gate and above the HNA lower limit (vertical line gate). |
For further information on how to adjust the gates see Change gates.
11.3.3 ACC cartridge
ACC refers to Active Cell Count. The ACC cartridge is therefore used to measure the concentration of metabolically active cells, using an enzymatic assay.
Table 11-5 Gating set used for the ACC cartridge.
| GATE | TYPE | DESCRIPTION |
|---|---|---|
| ACC | Polygon | A polygon defined on the FL1-FL2 plane. Points inside this polygon are counted as active cells (ACC). |
| HACC lower limit | Vertical line | A threshold on FL1. Points within ACC but larger than the HACC lower limit in FL1 are counted as HACC. Points within ACC but smaller than the limit are counted as LACC. |
Table 11-6 Result parameters obtained from the ACC cartridge.
| PARAMETER | UNIT | NAME | DESCRIPTION |
|---|---|---|---|
| ACC | 1/mL | Active Cell Count | Total number of active cells inside the ACC gate: ACC = HACC + LACC |
| HACC | 1/mL | Highly Active Cell Count | The number of active cells with FL1 intensity higher than the HACC vertical gate. |
| LACC | 1/mL | Lowly Active Cell Count | The number of active cells with FL1 intensity lower than the HACC vertical gate. |
| HACP | % | Highly Active Cell Percentage | The percentage of HACC among ACC. HACP = (HACC / ACC) × 100 |
For further information on how to adjust the gates see Change gates.
11.3.4 CBC cartridge
CBC refers to Coliform Cell Count. The CBC cartridge measures the concentration of coliform bacteria using an enzymatic assay based on β-galactosidase activity. The enzyme converts the cartridge substrate into a fluorescent product, enabling detection of the labelled cells by flow cytometry.
Table 11-7 Gating set used for the CBC cartridge.
| GATE | TYPE | DESCRIPTION |
|---|---|---|
| CBC | Polygon | A polygon defined on the FL1-FL2 plane. Fluorescently labelled coliform cells inside this polygon contribute to CBC. |
Table 11-8 Result parameter obtained from the CBC cartridge.
| PARAMETER | UNIT | NAME | DESCRIPTION |
|---|---|---|---|
| CBC | 1/mL | Coliform Cell Count | Concentration of labelled coliform cells inside the CBC gate, calculated from the cell count and analysed sample volume. |
For further information on how to adjust the gates see Change gates.
11.3.5 EBC cartridge
EBC refers to E. coli Cell Count. The EBC cartridge measures the concentration of Escherichia coli bacteria using an enzymatic assay based on β-glucuronidase activity. The enzyme converts the cartridge substrate into a fluorescent product, enabling detection of the labelled cells by flow cytometry.
Table 11-9 Gating set used for the EBC cartridge.
| GATE | TYPE | DESCRIPTION |
|---|---|---|
| EBC | Polygon | A polygon defined on the FL1-FL2 plane. Fluorescently labelled E. coli cells inside this polygon contribute to EBC. |
Table 11-10 Result parameter obtained from the EBC cartridge.
| PARAMETER | UNIT | NAME | DESCRIPTION |
|---|---|---|---|
| EBC | 1/mL | E. coli Cell Count | Concentration of labelled E. coli cells inside the EBC gate, calculated from the cell count and analysed sample volume. |
For further information on how to adjust the gates see Change gates.
11.3.6 NBC cartridge
NBC refers to Enterococcus Cell Count. The NBC cartridge measures the concentration of enterococci using an enzymatic assay based on β-glucosidase activity. The enzyme converts the cartridge substrate into a fluorescent product, enabling detection of the labelled cells by flow cytometry.
Table 11-11 Gating set used for the NBC cartridge.
| GATE | TYPE | DESCRIPTION |
|---|---|---|
| NBC | Polygon | A polygon defined on the FL1-FL2 plane. Fluorescently labelled enterococci inside this polygon contribute to NBC. |
Table 11-12 Result parameter obtained from the NBC cartridge.
| PARAMETER | UNIT | NAME | DESCRIPTION |
|---|---|---|---|
| NBC | 1/mL | Enterococcus Cell Count | Concentration of labelled enterococci inside the NBC gate, calculated from the cell count and analysed sample volume. |
For further information on how to adjust the gates see Change gates.
11.4 Change gates
11.4.1 Regate measurements
Regating is the process of applying a different gating set to existing measurement data.
- A prerequisite for regating is the presence of such additional gating set. On the Home screen, press Settings, then Gate settings to view the available gating sets.
- The process of modifying an existing gating set is described in Edit existing gating sets.
WORK STEP | ADDITIONAL INFO / IMAGES | |
|---|---|---|
1. | On the Home screen, press Settings to open the settings menu. | |
2. | Press Logs, then Results (manual mode) or Results (online mode), depending on how the measurement was performed. | |
3. | To regate a single measurement, select the measurement to see the result details page. To regate multiple measurements (batch), long-press on the measurement, until it is highlighted and a check box appears on the left. Then tap on more measurement to also select them for regating. | |
4. | Press Re-gate result in the single-result view, or Re-gate when several measurements are selected. | |
5. | Select the desired gating set by checking its box. | |
6. | Press the Confirm button to start the regating process. | Additional information Depending on the number of measurements, regating can take several minutes. |
7. | After finishing, press OK. |
11.4.2 Create a new gating set
New gating sets can be created either from a copy of an existing gating set, or from scratch.
Creating a new gating set from a copy
| WORK STEP | ADDITIONAL INFO / IMAGES | |
|---|---|---|
| 1. | As an Advanced or Admin user, press Settings on the Home screen to open the settings menu. | |
| 2. | Press the Gate settings button. | |
| 3. | In the list of available gating sets, identify the gating set from which you want to make a copy to create the new gating set. | Make sure the gating type (e.g. TCC, ICC) matches with your target application. |
| 4. | Press the Copy icon to create a copy of the gating set. | |
| 5. | In the newly generated copy, press the Edit icon and follow the editing instructions in Edit existing gating sets. |  |
Creating a new gating set from scratch
| WORK STEP | ADDITIONAL INFO / IMAGES | |
|---|---|---|
| 1. | As an Advanced or Admin user, press Settings on the Home screen to open the settings menu. | |
| 2. | Press the Gate settings button. | |
| 3. | In the action bar at the bottom, press New. | |
| 4. | Enter a name for the set of gates and select one of the available templates for the installed cartridge. | |
| 5. | Then follow the gate configuration on- screen wizard as describe in the gate editing instructions in Edit existing gating sets. | |
| 6. | After finishing, you can select the new gating set when creating new measurements, or regate existing measurements, as described in Regate measurements. |
11.4.3 Edit existing gating sets
Apart from default gating sets, all other gating sets can be modified. Gate editing can comprise renaming, changing the position of the vertical gate, and changing the number and position of the corners of the polygon gate.
In this section, the general process of editing a gating set is described. Strategy to adjust gates for TCC and ICC describes a specific strategy to adjust gating sets for TCC and ICC measurements.
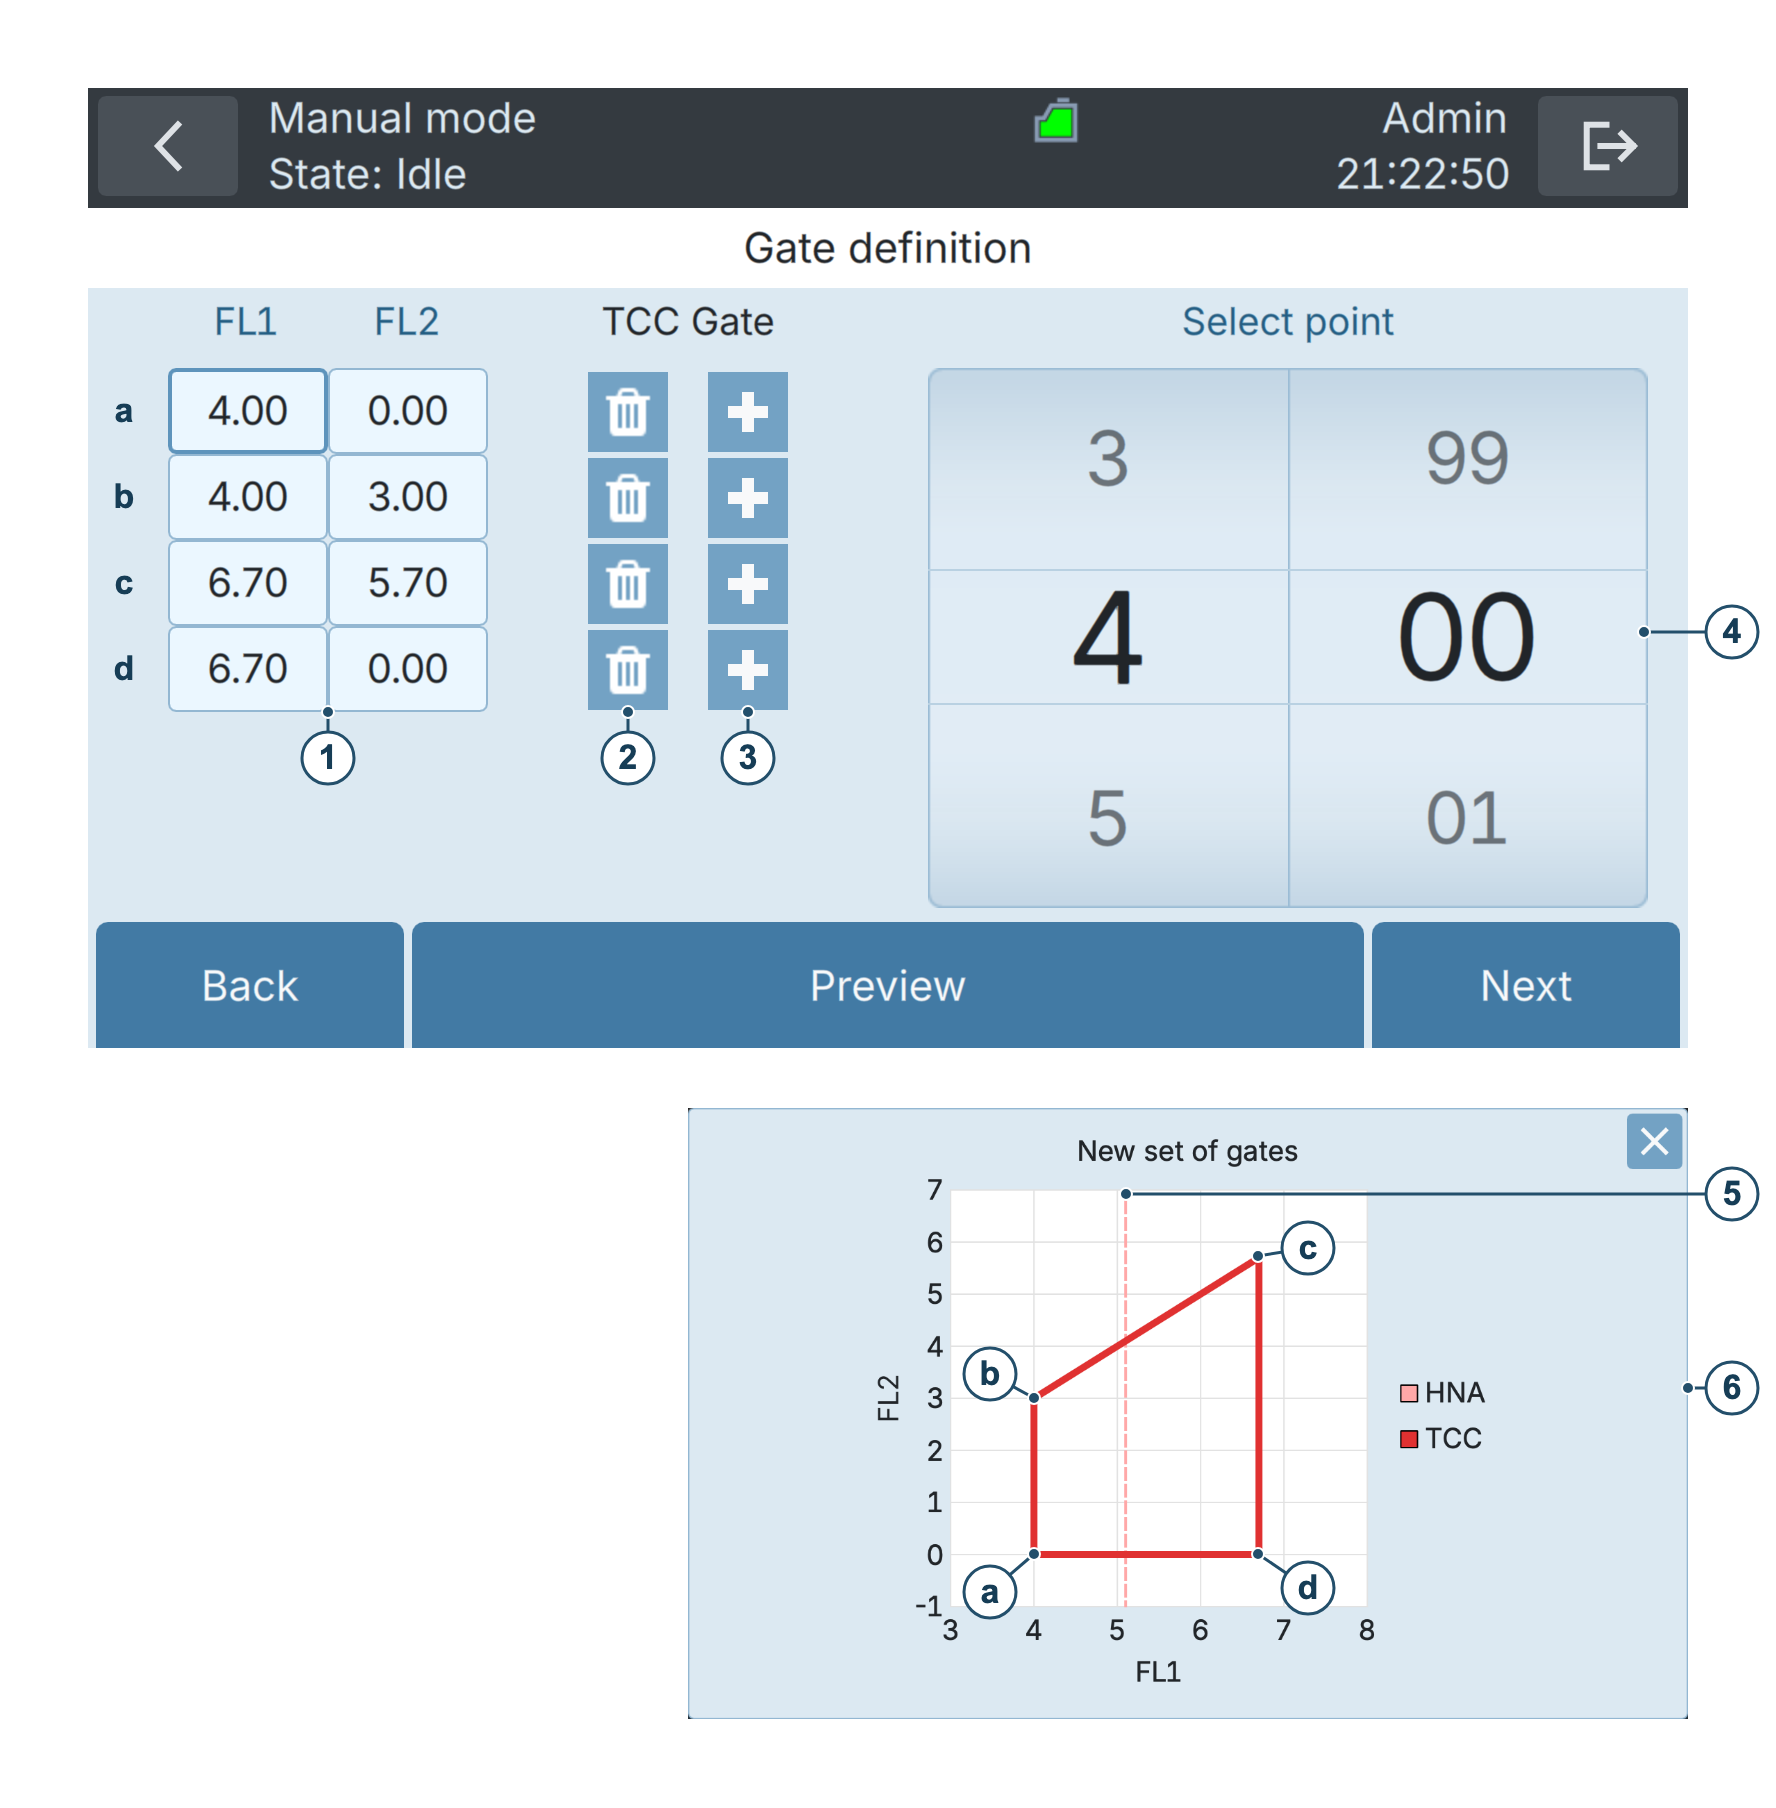
Figure 11-3 Gate settings for TCC
| ① | Coordinates of the gate’s points. a: First point in the gate b: Second point in the gate c: Third point in the gate d: Fourth point in the gate | ② | Remove a point from the gate. |
| ③ | Add a new point to the gate. | ④ | Modify the selected coordinate. In this screenshot, the FL1 (a, FL1) coordinate of the first point is selected, so we can move the first point in the gate along the FL1 axis (X-axis). |
| ⑤ | HNA lower limit: this gate is defined on the next screen. | ⑥ | Preview |
The following procedure describes how to adjust a gate:
| WORK STEP | ADDITIONAL INFO / IMAGE | |
|---|---|---|
| 1. | As an Advanced or Admin user, press Settings on the Home screen to open the settings menu. |  |
| 2. | Press the Gate settings button. |  |
| 3. | Press the Edit button of the gate you wish to edit. | |
| 4. | Change the name if desired, then press the Next button. | |
| 5. | Adjust the number and position of polygon corners (for TCC and ICC refer to Strategy to adjust gates for TCC and ICC). A polygon gate can have between 3 and 6 corners. | 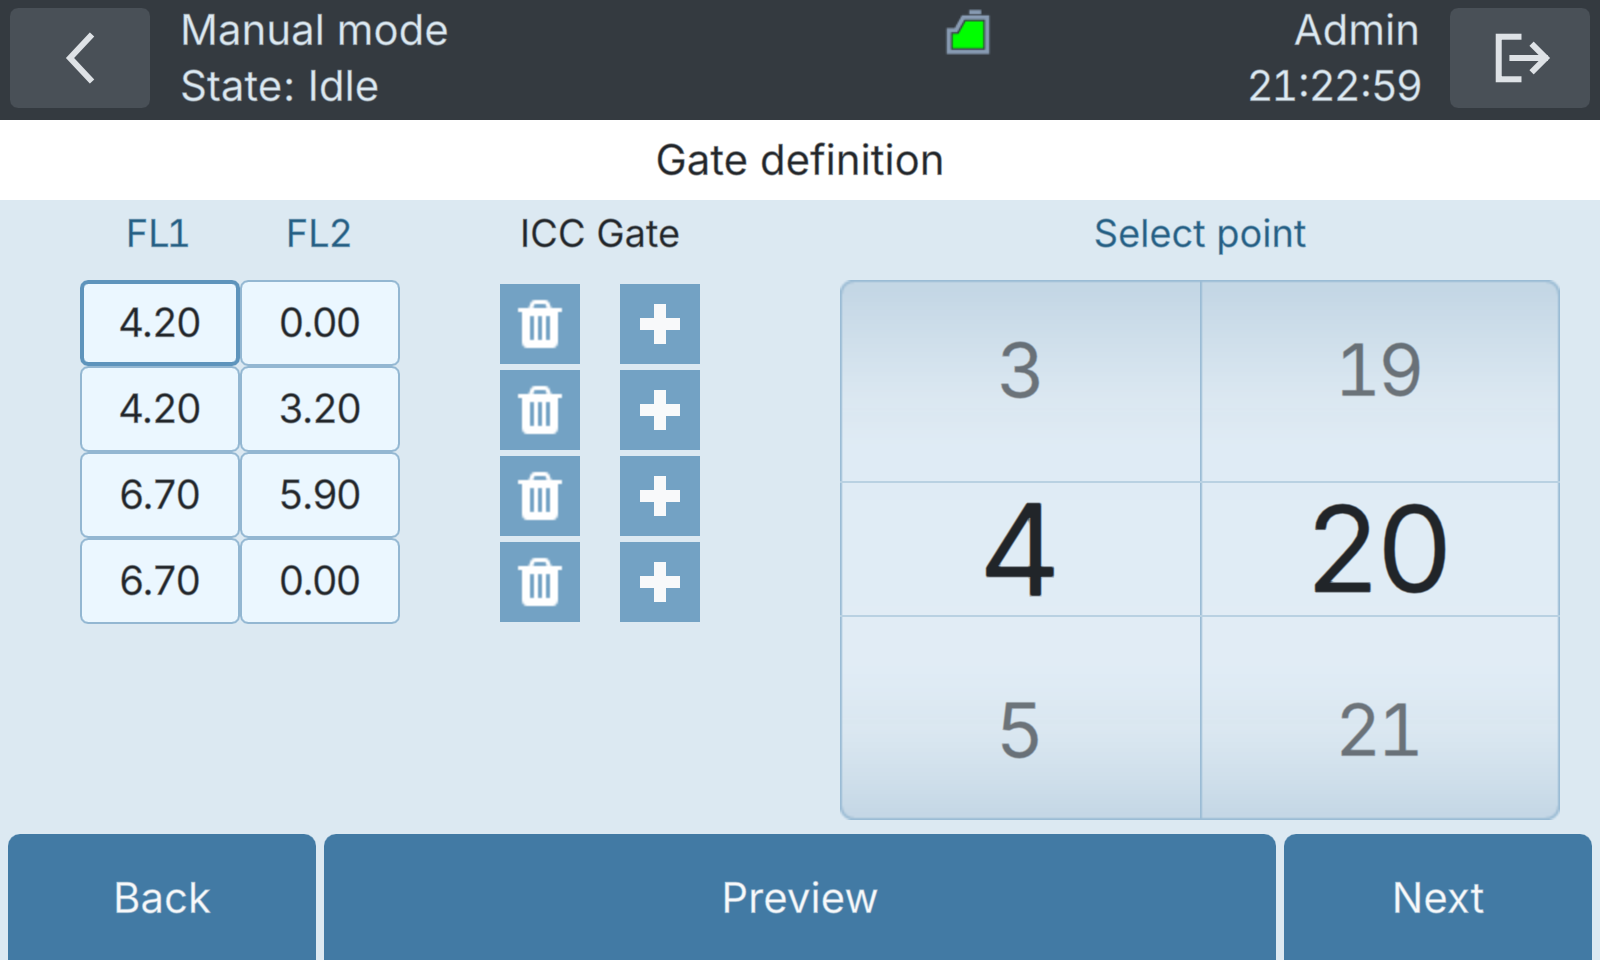 |
| 6. | Press the Next button. | |
| 7. | Enter the HNA lower limit (for TCC and ICC refer to Strategy to adjust gates for TCC and ICC). | 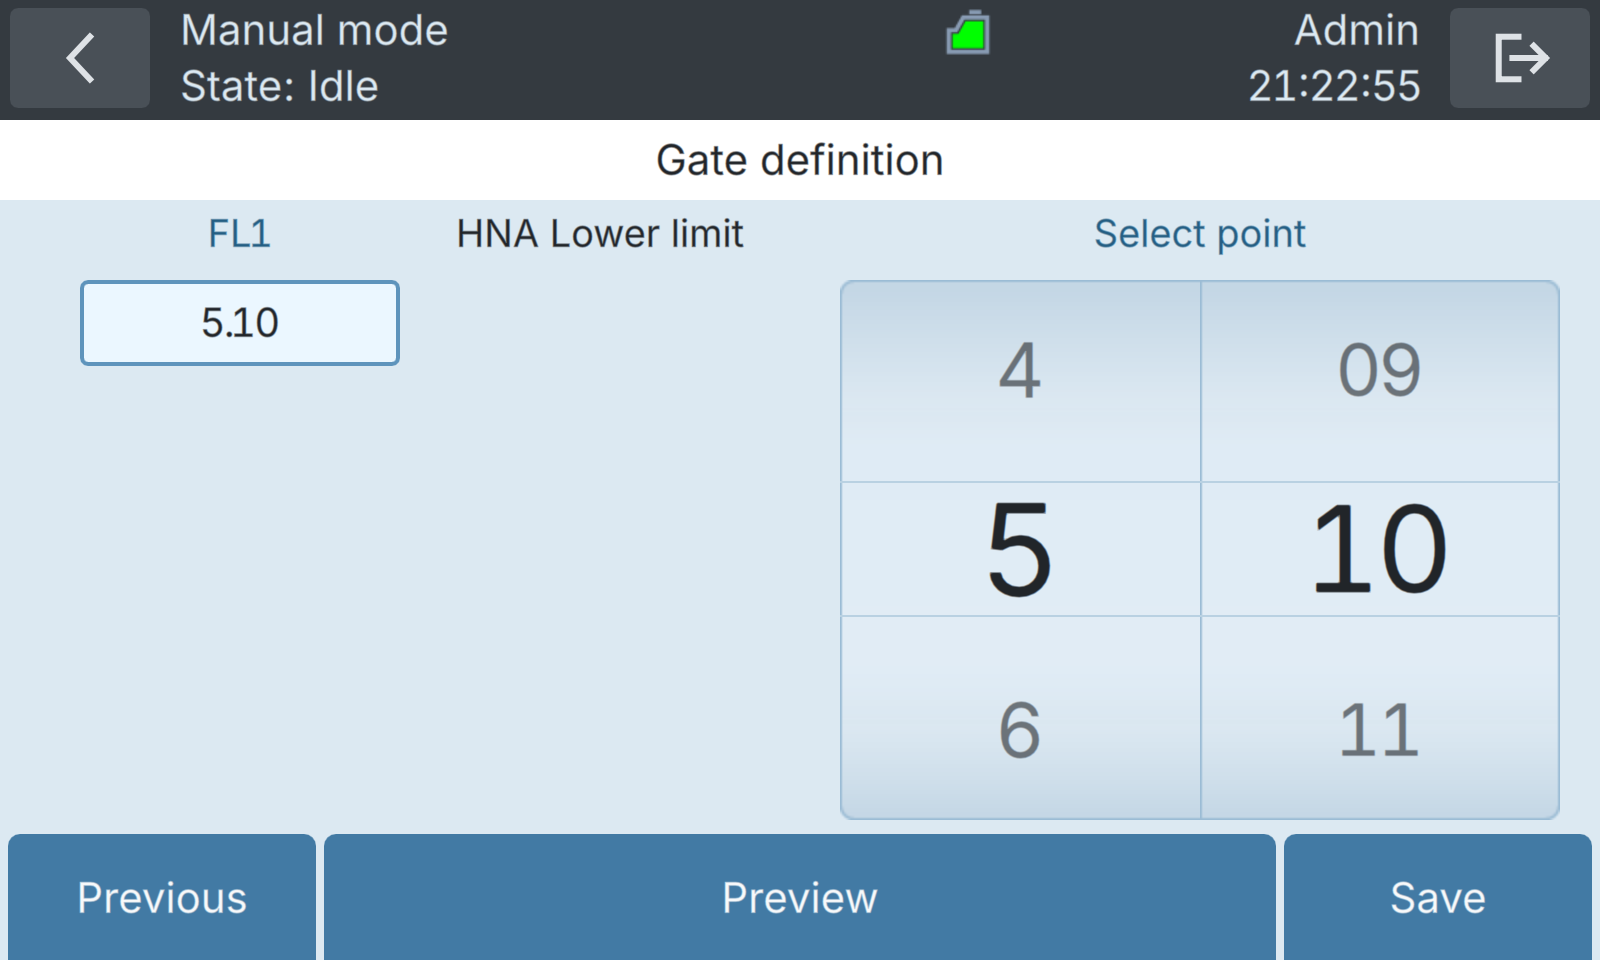 |
| 8. | Press Save. In the save dialog, choose Save to update the existing set, or Save as new set to keep the original and create a new set. | |
| 9. | After finishing, you can select the modified gating set when creating new measurements, or regate existing measurements, as described in Regate measurements. |
11.4.4 Strategy to adjust gates for TCC and ICC
The BactoSense is delivered with default gate sets that are suitable for the vast majority of samples. If needed however, advanced users have the possibility to adjust the gate. A general procedure to adjust the gate is explained below and is valid for both TCC and ICC cartridges.
WORK STEP | ADDITIONAL INFO / IMAGE | |||||||||||
|---|---|---|---|---|---|---|---|---|---|---|---|---|
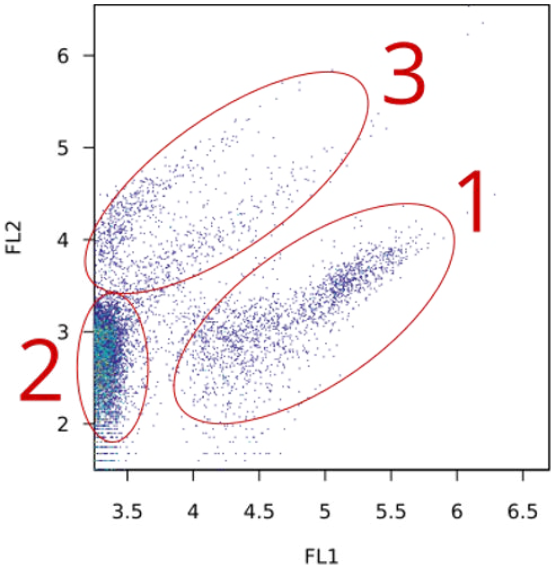
1. | Measure a water sample using the standard Water analysis protocol. On the Result details page, the FL1 vs FL2 dotplot shows: 1) LNA and HNA cells in the water 2) Electrical noise from the optical detectors 3) Debris/background noise (This can include damaged cells, aggregates or other particles) |
| ||||||||||
2. | On the Home screen, press Settings to open the settings menu. Press the Gate settings button. | |||||||||||
3. | Depending on your needs, perform one of the following: | |||||||||||
4. | Give a name to this set of gates and press Next. | |||||||||||
5. | Place the polygon gate at each extremity (left and right). For example, use these four points:
|
| ||||||||||
6. | Press Next and Save. For a new template, confirm with Yes. For an edited set, choose Save or Save as new set in the save dialog. | |||||||||||
7. | Navigate to the result view of the water sample you measured previously. | |||||||||||
8. | On the result view, press the Re-gate result button. | |||||||||||
9. | Select the gate you just created, and re- process the data with the new gate by pressing the button Confirm. | |||||||||||
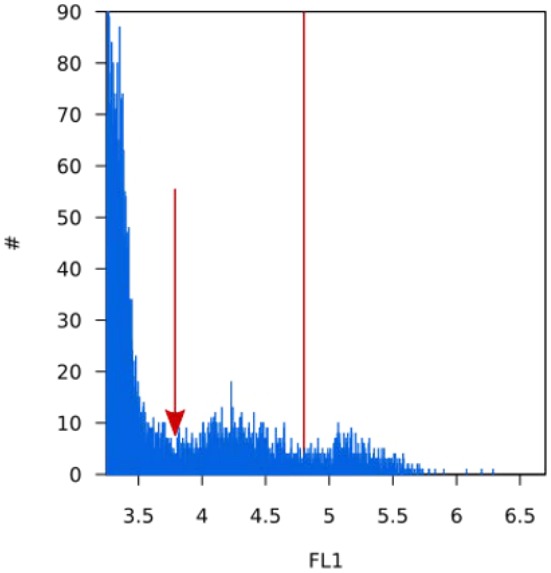
10. | Open the FL1 histogram and locate the first valley after the noise peak, i.e. the first minimum after the peak at the extreme left (arrow in the picture). Write down the FL1 value of this minimum (e.g. 3.8). |
| ||||||||||
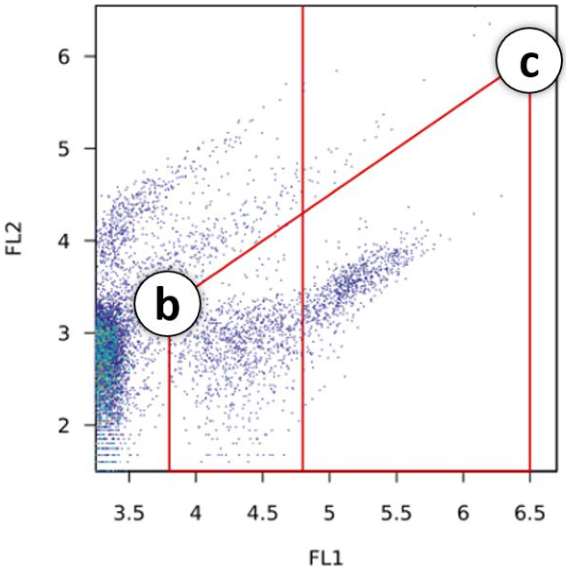
11. | Return to Gate settings and again edit your gate. Place the left limits of the gate at the previously determined FL1 value. This will exclude the electrical noise of the optical detectors. If needed, for the FL2 axis, place the points “b” and “c” of the gate just below the debris/background area (generally appearing as straight diagonals). |
| ||||||||||
12. | Save the adjusted gate. | |||||||||||
13. | Navigate again to the result view of the water sample you measured previously. | |||||||||||
14. | On the result view, press the Re-gate result button. | |||||||||||
15. | Select the gate you just created, and re- process the data with the new gate by pressing the button Confirm. | |||||||||||
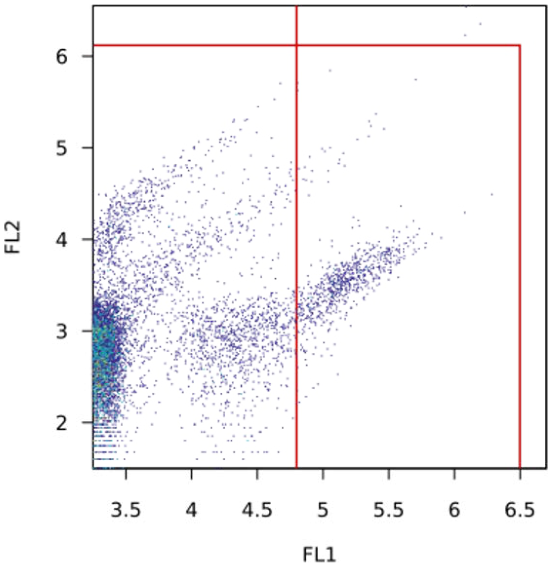
16. | To place the HNA lower limit, open again the FL1 histogram and locate the minimum between the LNA and HNA peaks (vertical line on the image). Write down its FL1 value (e.g. 4.8). |
| ||||||||||
17. | Return to Gate settings and again edit your gate. | |||||||||||
18. | Navigate to the HNA lower limit configuration step. Enter the previously identified HNA lower limit to the FL1 field, press Save and select Save in the save dialog. | |||||||||||
19. | Regate the water analysis measurement again and verify that the gate is suitable. Further adjust if needed. |
11.5 Advanced data analysis
BactoSense measurement data can be exported in Flow Cytometry Standard (FCS) 3.1 file format. The FCS file format is standardized by the International Society for Advancement of Cytometry (ISAC) to ensure interoperability between different flow cytometry instruments and analysis software. There are different versions of the FCS format with each version introducing improvements and additional features. FCS data can be used for custom offline postprocessing, such as the application of complex gating strategies, “microbial fingerprinting”, automated anomaly detection and many more.
11.5.1 How to retrieve FCS files
FCS files can be retrieved in the following ways:
-
Download to a USB stick: Using the Export all function (see Export settings, diagnostics, or all to USB device)
-
Download from the web interface, either as single files (see Download an FCS-file) or multiple files (see Download a zip file with multiple results)
-
Access using FTP (see Retrieve data via FTP)
-
Access using HTTPS (see Retrieve files via HTTP or HTTPS)
For help with the setup of an advanced data analysis tool chain, please contact support@bnovate.com.
11.6 Comparison with other flow cytometers
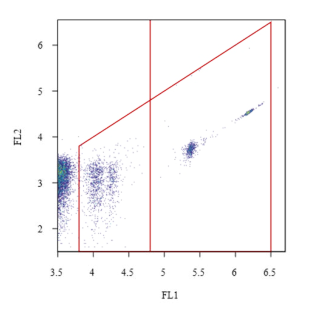
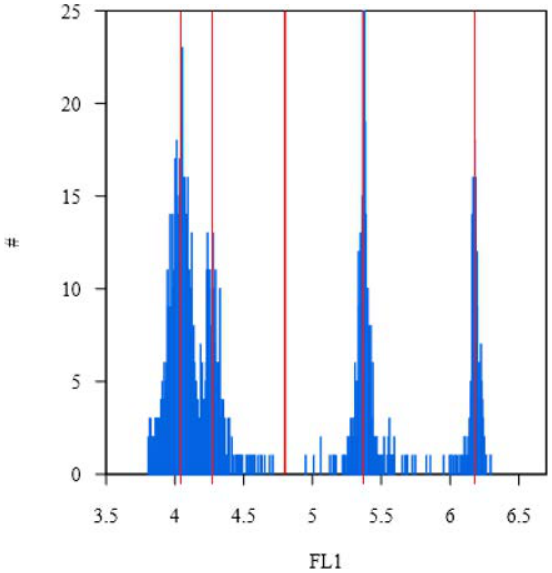
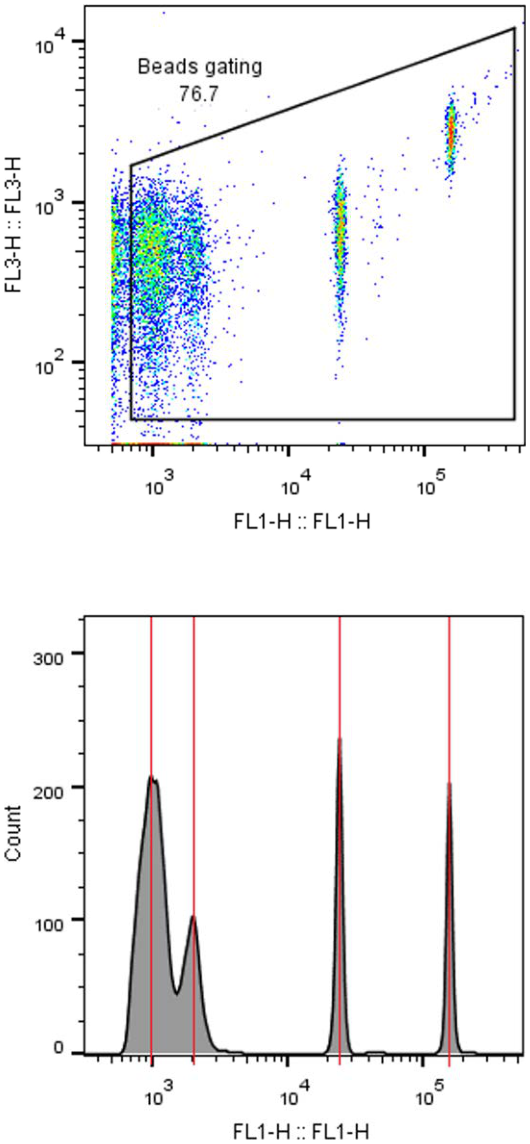
To compare results of the BactoSense to another flow cytometer, a reference solution containing auto fluorescent beads can be analyzed. This method allows the user to compare the measurement scales of different devices.
WORK STEP | ADDITIONAL INFO / IMAGE | ||
|---|---|---|---|
1. | It is recommended to use the Validation Kit which contains a ready to use beads solution. | Read the instructions of the Validation Kit for more information. | |
2. | Install the manual sampling device according to the user manual. | ||
3. | Take of one of the Validation kit’s beads solutions and load it into the sampling device. | Read the instructions of the Validation Kit for more information. | |
4. | Additional information Press the Home button. Press the Back button as many times as needed for the Home button to appear. |
|
|
5. | On the Home screen, press Mode and select Manual mode. Press Back, then Measure to open the measurement wizard. | ||
6. | Select Prime from the protocol list. | See Performing a Prime. | |
7. | Press the Next and Start button. Let the priming protocol finish. | ||
8. | Press New, choose Beads Analysis from the list, then press Next and Start. | ||
9. | Wait for the results and if necessary, precisely adjust the gate of the FL1 vs FL2 dot plot to count only the 4 populations of beads. It is important to ensure that noise, background, and debris are not counted into the gate. | See Edit existing gating sets to adjust the gate. | |
10. | On the FL1 vs counts histogram, estimate the log value of each peak’s center on the FL1 axis. In this example, we obtain approximately (in log): 1st peak = 4.05 2nd peak = 4.3 3rd peak = 5.35 4th peak = 6.2 |
| |
11. | Measure the same beads with the other flow cytometer you want to compare and repeat the steps 10 and 11. In this example, we obtain approximately (in log): 1st peak = log(103) = 3 2nd peak = log(2103) = 3.3 3rd peak = log(2.4104) = 4.4 4th peak = log(1.6*105) = 5.2 |
| |
12. | With the different values obtained for both devices, it is now possible to compare their scales and their measurement windows. | ||